Access to this website is subject to applicable laws and regulations.
Moneta Markets is not established in or operating from Singapore and does not offer its products or services to Singapore citizens or residents. Account applications from Singapore citizens or residents will not be accepted.
If these restrictions apply to you, you should not open an account or use any products or services offered by Moneta Markets.
By continuing, you confirm that you are accessing this website on your own initiative and not as a result of any direct solicitation, invitation, or targeted marketing by Moneta Markets.
Content on this website does not serve as an offer, invitation, solicitation or promotion of any product or service in any jurisdiction where such activity is barred by law, and you remain solely obligated to ensure your access complies with all local regulations.
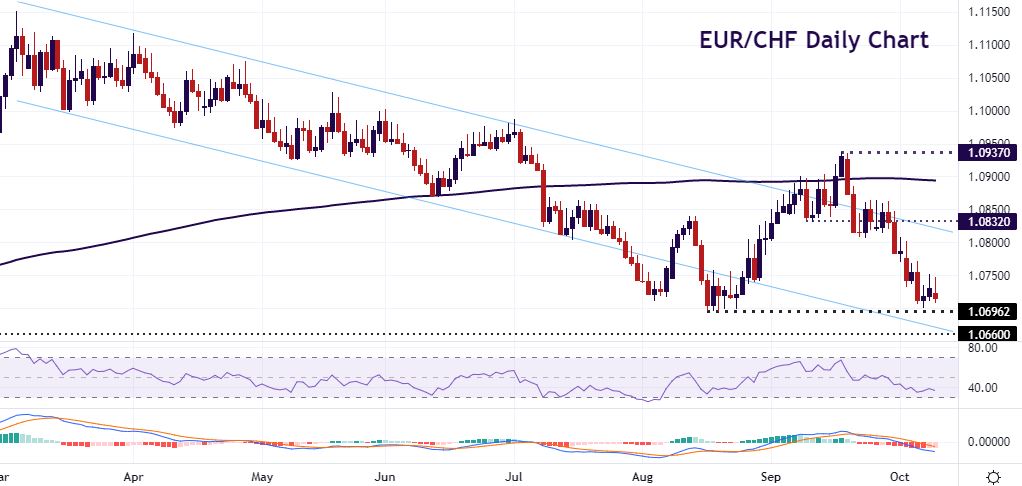
We’ve written before about the SNB potential “line in the sand” for EUR/CHF at 1.07 and we are hovering just above it at present. This appears to be the level where the central bank has intervened before to stop the swissie appreciating according to liquidity data and deposits. That said, if the bank was using the real trade-weighted CHF, the level would be lower.
We can see the pair bounced a couple of times in August from around this mark after dipping out of the descending channel from the March highs. The rebound took us above the 200-day SMA and briefly out of the bearish channel. Sellers have regained control again after consolidation around 1.0832. We are now close to the summer low at 1.0695.
Bearish momentum is still evident with prices not yet in oversold territory. The November 2020 low at 1.0660 is the next level of support if we continue to move in line with the dominant long-term trend. Another rebound, perhaps on the back of SNB intervention, will need to get back above 1.08 and last week’s high to slow the momentum.
EUR/CAD sinks ever lower
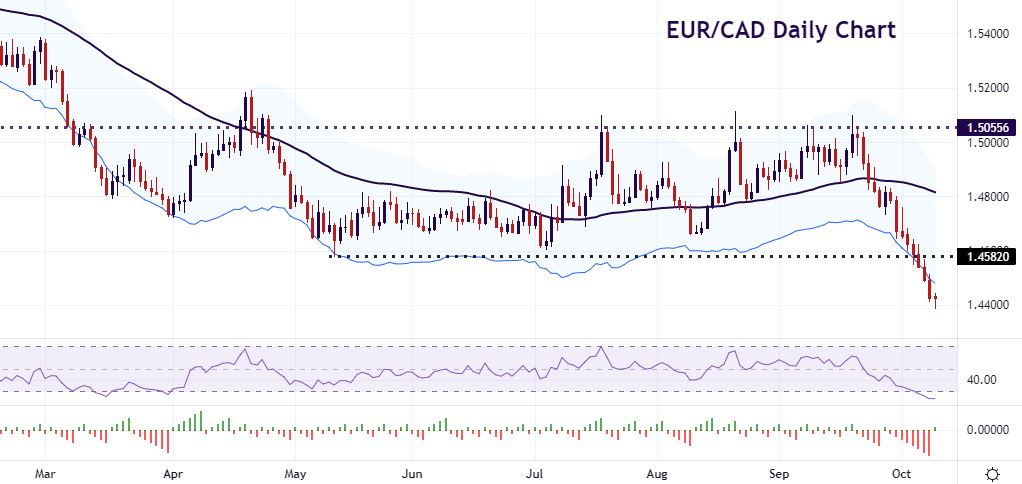
This pair has dropped for nine straight days and counting, a run not seen since February last year. Notably, prices are now even more oversold on several momentum indicators, including the daily RSI. We are also through the lower Keltner channel so would expect to see some retracement.
Prices had been trapped in a range for several months between 1.46 and 1.50 more or less. But after topping out again last month around last summer’s lows, we’ve been in freefall, down 14 days out of the last 15. Initial resistance sits around the bottom of the recent range at 1.46. We are currently trading near the January 2020 lows and the October 2019 lows. The long-term low is the February 2020 spike low at 1.4263.